
This blog post will focus on memory issue case, and I’ll walk you through my experiences in investigating and resolving it. The issue involved WPEWebKit and the Cairo graphics library. I’ll also cover the tools I used for memory profiling and how I ultimately found problem.
keywords: memory leak, WPEWebKit, Cairo, google-perftools.
The Context
“It’s not a matter of if, but when”.
As a software developer, whether during the coding phase or ongoing maintenance, encountering memory-related issues is nearly inevitable.
For those working in languages with manual memory management, especially seasoned developers of C and C++, bugs related to memory — such as double frees, invalid memory accesses, and leaks — are all too familiar.
Common memory problems, including memory leaks, buffer overflows, and insufficient allocation, can quickly escalate into significant headaches. These issues often result in degraded performance, system crashes, or even security vulnerabilities.
These kind of bugs often arise in user-space programs, where memory is managed without special safeguards—let alone in more complex scenarios involving CMA, mmap(), DMAbuf …
Tackling these challenges requires a deep understanding of how your application handles memory, along with careful debugging and optimization to ensure efficient, safe memory usage.
In my experience, you won’t always be able to rely on the same tool or approach to analyze memory-related issues. More often than not, the code where the defect is found will be complex and, quite possibly, not written by you. Additionally, in many cases, you won’t be able to create a simple test case to replicate the issue until after investing significant time and effort in understanding and pinpointing the exact root cause. One such scenario is the case I want to discuss today.
Some time ago, I had to track down a memory issue in WPEWebKit. Given the nature of WebKit, the problem naturally involved threads, subprocesses, IPC message passing, and graphical buffers. To make matters more challenging, this was on a low-profile target device with very limited RAM and CPU power.This blog post serves as a brief summary of that experience.
The Case
“Same old story”.
Every good case has its usual suspects, and this one was no exception. The issue I encountered involved a webpage running a 2D animation on a canvas. Initial observations revealed a slow but steady increase in memory usage, eventually leading to memory exhaustion.
We knew it was a memory issue. The memory consumption of the WebProcess — the process responsible for composing and rendering the webpage frames — kept growing, slowly but steadily.
From the context and a series of checks on the webpage JavaScript logic, it seemed the error was related to the canvas painting or, more simply, a common JavaScript programming pitfall. Perhaps a temporary object was being stored in the global context, maybe in an array, or there could be a bug within WebKit’s canvas rendering code.
However, early observations are rarely definitive. They provide a starting point but often lead to multiple discarded ideas before the real issue is found. This case was no different part of the process is separating the wheat from the chaff.
The Debug
Discarding JavaScript Pitfalls
“First things first …”
… before diving into the code, we need to rule out the possibility that the issue lies within the webpage itself.
To analyze potential JavaScript pitfalls, the WebKit Web Inspector provides a powerful tool—the Memory Timeline and the JavaScript Allocations Timeline. In short, the Memory Timeline helps categorize and understand memory usage, identify spikes, and detect overall memory growth. Meanwhile, the JavaScript Allocations Timeline assists in recording, comparing, and analyzing snapshots of the JavaScript heap to track memory growth and detect leaks.
The snapshot offers valuable insights into the memory distribution of your application, helping to identify leaks and inefficiencies. For a more detailed walkthrough, I would suggest a visit to the original WebKit blog post on memory debugging, which provides a comprehensive guide on how to use these tools.
Regarding my case, to use the console.takeHeapSnapshot(<label>) command in the Web Inspector, I needed to start by opening Web Inspector in the browser while running the web application. Here’s a simple explanation of how I used this:
- Taking a Heap Snapshot:
- In the Web Inspector, go to the “Timelines” tab.
- Open the console and type
console.takeHeapSnapshot("Snapshot 1"), where"Snapshot 1"is a label of your choice. This command will create a snapshot of the JavaScript heap at that point in time.
- Interpreting the Snapshot:
- After taking the snapshot, switch to the “Memory” tab to view the details.
- You’ll see a graph and a list showing memory allocations by type and context.
- Look for areas where memory usage is unexpectedly high or where objects aren’t being released as expected.
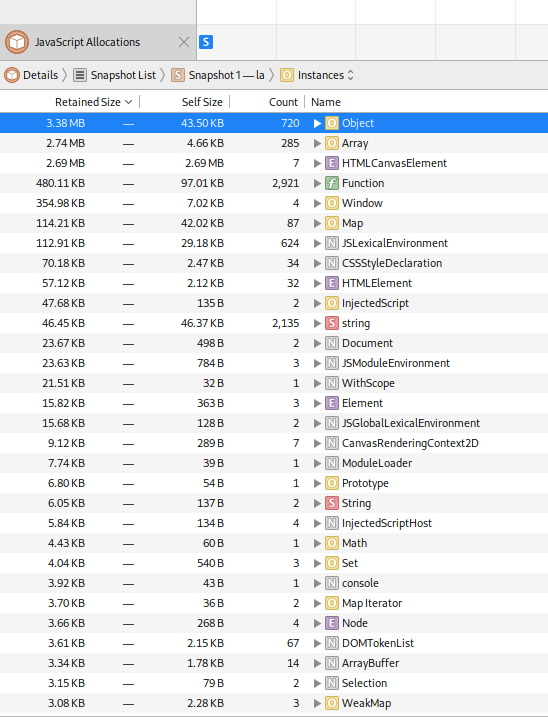
Unfortunately for me, the analysis didn’t shed any light on the issue. Multiple runs of console.takeHeapSnapshot(<label>) showed no steady increase in objects within the JavaScript Context, which could indicate a design flaw in the webpage. Therefore, the webpage itself can be ruled out as the cause.
Creating a simplified scenario
… “Time to read between the lines. Less is More”.
I began my investigation by dissecting the test page. Of course, the real webpage I had to debug was far more complex than the simplified example I will use here for illustration. For clarity’s sake, I’ll present a distilled version of the relevant parts.
<!DOCTYPE html>
<html>
<body>
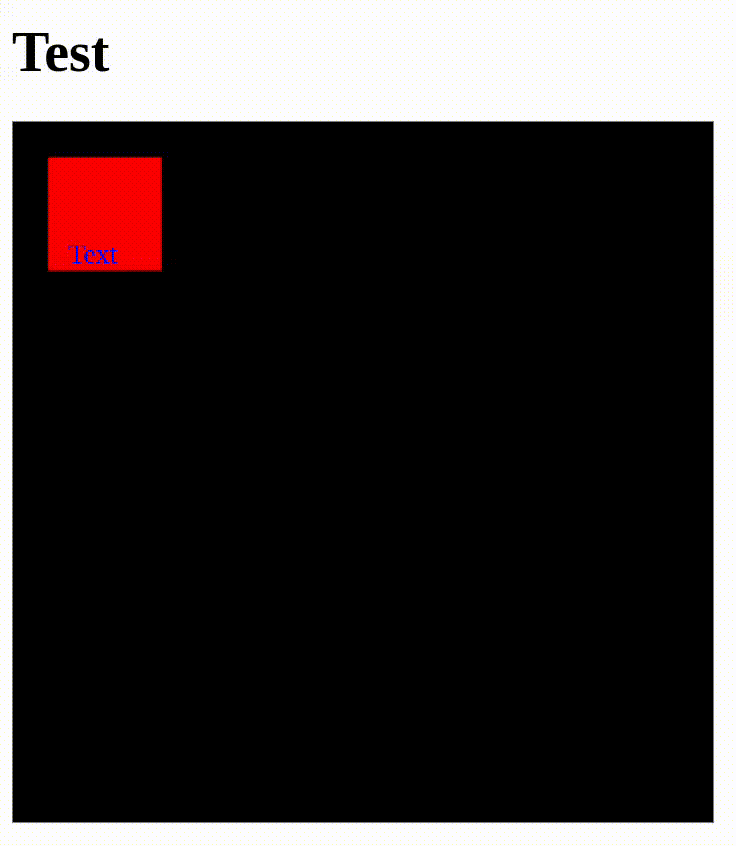
<h1>Test</h1>
<canvas id="myCanvas" width="620" height="620" style="border:1px solid grey"></canvas>
<div id="id-text"/>
<script>
function addText() {
var element = document.getElementById('id-text');
var newHtml = `
<div id="id-text" style="top: 146px; left: 40px; width: 250px; height: 334px; background-color: transparent; position: absolute; color: rgb(0, 0, 255);">
<div>Text</div>
</div>`;
element.outerHTML = newHtml;
}
const canvas = document.getElementById("myCanvas");
const max_size = 400;
canvas.width = canvas.height = max_size;
canvas.style.position = "absolute";
canvas.style.cursor = "not-allowed";
canvas.style.pointerEvents = "none";
canvas.style.backgroundColor = "black";
const ctx = canvas.getContext("2d", { alpha: true });
ctx.fillStyle = "red";
var frame_counter = 0;
const frame_rate = 60;
const duration = 5;
const margin = 20;
function drawRandomRectangle() {
size = (max_size - 2*margin) * (frame_counter++ / (frame_rate * duration));
// console.log("Size " + size);
// Clear the canvas
if (size > max_size - 2*margin)
{
console.log("Clear");
ctx.clearRect(0, 0, max_size, max_size);
frame_counter = 0;
}
else
{
// Draw the rectangle with size dimensions
ctx.fillRect(margin, margin, size, size);
}
addText();
window.requestAnimationFrame(drawRandomRectangle);
}
window.requestAnimationFrame(drawRandomRectangle);
</script>
</body>
</html>
The webpage creates a canvas element where a red rectangle is animated to grow in size over time, resetting once it reaches a maximum size. The canvas is styled with a black background, and its pointer events are disabled. Additionally function dynamically updates a text element, positioning it on the page as an absolutely positioned blue text block over the canvas. The drawRandomRectangle function handles the animation of the rectangle by gradually increasing its size, clearing the canvas when the rectangle exceeds the specified dimensions, and restarting the animation. The function is continuously called using requestAnimationFrame to ensure a smooth animation.
In the next image, we can see the evolution of memory consumption over time. It’s important to note, although it’s not very clear in the graph, that the situation eventually leads to the Linux OOM (Out-Of-Memory) killer being triggered due to memory starvation caused by the WPEWebProcess consuming too much memory.

One potential complication I forgot to mention earlier is that this issue was reported on a WPEWebKit instance running on an ARM-based board, which is a common scenario when dealing with WPEWebKit. Problems like these are often tied to a specific target machine, and two possibilities arise: either the issue is linked to the hardware or software stack, influencing the behavior, or, with some luck, the problem can be replicated on x86, avoiding the challenges of cross-compilation.
The good part of the memory issues is that they tend to be software-related rather than hardware-specific. Even so, the problem may still be caused by the libraries, versions, or specific compilation flags used to build WebKit for that target. So, the first step was to see if I could replicate the problem on x86. The guiding principle: Let’s compile on my laptop and see if we can continue debugging directly on it.
time Tools/Scripts/build-webkit --makeargs=-j14 --wpe --release --cmakeargs "-DENABLE_INTROSPECTION=OFF -DENABLE_DOCUMENTATION=OFF -DENABLE_COG=OFF" --no-bubblewrap-sandbox
./Tools/Scripts/run-minibrowser --wpe "https://people.igalia.com/psaavedra/test/20220530_issue.html"
I proceeded to measure the memory behavior and was fortunate to find that the problem could be reproduced on the laptop too, allowing us to continue debugging without the need for remote GDB servers or cross-compilation. Running everything natively on x86 simplifies the process significantly.
Let’s Get to Work: Profiling Memory with Google-Perftools
As I’ve mentioned, memory issues can be a serious problem in software development. Often, these issues are tied to segmentation faults, potentially caused by incorrect overwriting in the program logic. In those cases, we can rely on GDB and access debug symbols to perform a deep debugging session, track down the problem, and fix it.
Also, when faced with a crash caused by double-free errors or with memory leaks, tools like Valgrind or libASAN, are invaluable for performing heap checks, identifying who initialized the memory, where it was released, and getting us closer to a solution. These tools are helpful for detecting direct memory leaks, where a pointer to a previously allocated memory area is lost.
However, not all memory issues fit the typical definition of leaks. In this case, I encountered a different kind of memory leak. These aren’t leaks in the strict sense, but rather logical programming errors that result in unchecked memory growth. Typically, this happens when values are stored in memory — often within data structures like stacks, lists, trees, or hashes — without proper cleanup or release when they’re no longer needed.
In these situations, the memory remains valid and accessible to the application, but due to a logical flaw, it is never freed, causing the program’s memory usage to grow uncontrollably. For these situations, a memory heap checker can be what you really need.
I found Google-Perftools to be an incredibly useful tool for tracking and analyzing memory usage for these kind of cases.
Designed as a memory profiler with a focus on performance, Google Perftools helps identify inefficiencies without adding significant overhead. Unlike AddressSanitizer (ASAN), which is primarily geared towards detecting memory-related bugs like out-of-bounds access or use-after-free errors, Google Perftools emphasizes performance optimization. It provides tcmalloc (a fast memory allocator), a heap profiler, and a memory leak detector, making it a versatile option for debugging memory issues.
The following steps describe what I did to debug the memory issue using Google Perftools.
Step 1: Installing Google Perftools
First, install the required packages:
sudo apt-get install google-perftools libgoogle-perftools-dev
Step 2: Building WPEWebKit and Linking with Perftools
To build WPE and link it against Perftools:
export LDFLAGS="-lprofiler -ltcmalloc"
time Tools/Scripts/build-webkit --makeargs=-j14 --wpe --release --cmakeargs "-DENABLE_THUNDER=OFF -DENABLE_INTROSPECTION=OFF -DENABLE_DOCUMENTATION=OFF -DENABLE_COG=OFF" --no-bubblewrap-sandbox
Step 3: Injecting Perftools Environment Variables
Next, inject Perftools’ environment variables into the WPEWebProcess:
mv /home/psaavedra/dev/WebKit/WebKitBuild/WPE/Release/bin/WPEWebProcess /home/psaavedra/dev/WebKit/WebKitBuild/WPE/Release/bin/WPEWebProcess.real

cat << EOF > /home/psaavedra/dev/WebKit/WebKitBuild/WPE/Release/bin/WPEWebProcess
#!/bin/bash
export HEAPPROFILE=/tmp/prof.log HEAP_PROFILE_INUSE_INTERVAL=1048576 HEAP_PROFILE_MMAP=true
exec /home/psaavedra/dev/WebKit/WebKitBuild/WPE/Release/bin/WPEWebProcess.real \$@
EOF

chmod +x /home/psaavedra/dev/WebKit/WebKitBuild/WPE/Release/bin/WPEWebProcess
Step 4: Run the minibrowser
./Tools/Scripts/run-minibrowser --wpe "https://people.igalia.com/psaavedra/test/20220530_issue.html"
Starting tracking the heap
Dumping heap profile to /tmp/prof.log.0001.heap (1 MB currently in use)
Dumping heap profile to /tmp/prof.log.0002.heap (2 MB currently in use)
Dumping heap profile to /tmp/prof.log.0003.heap (3 MB currently in use)
Dumping heap profile to /tmp/prof.log.0004.heap (4 MB currently in use)
...
Step 5: Generating a Visual Memory Report
To visualize the memory usage, use the google-pprof tool:
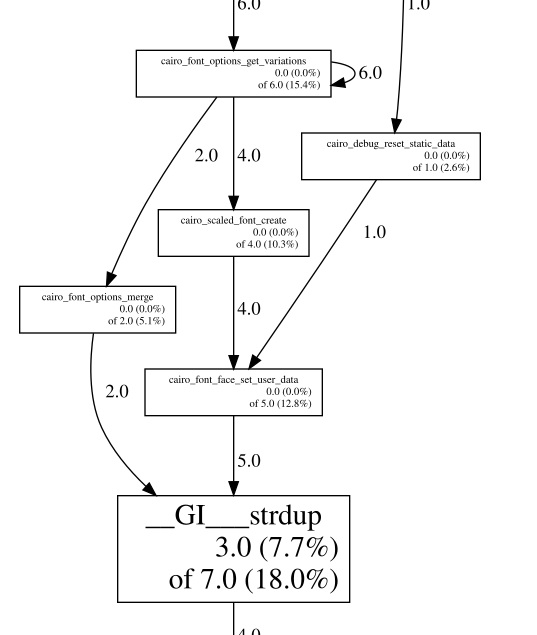
google-pprof --base=/tmp/prof.log.0009.heap --svg /home/psaavedra/dev/WebKit/WebKitBuild/WPE/Release/bin/WPEWebProcess /tmp/prof.log.0011.heap > memory_profiling.svg

The command compares the memory usage between two heap profiles (prof.log.0009.heap as the base and prof.log.0011.heap as the target), generates a visual report of the differences as an SVG file (memory_profiling.svg), and uses WPEWebProcess as the executable to analyze:
--base=/tmp/prof.log.0009.heap: This option specifies the base heap profile file. The base profile represents the state of the heap at an earlier point in time. When generating a memory profile,pprofwill compare the current profile against this base to show the difference in memory allocation between these two points./tmp/prof.log.0011.heap: This file represents a memory profile captured at a later point in time compared to the base. It contains memory allocation and usage information from that moment in execution.--svg: This option instructspprofto output the memory profiling information as an SVG file, a visual representation of the memory usage./home/psaavedra/dev/WebKit/WebKitBuild/WPE/Release/bin/WPEWebProcess: This is the binary executable that was profiled. It’s the target program for which the memory profiling was performed (in this case,WPEWebProcess), and it’s necessary forpprofto properly analyze the memory allocations.> memory_profiling.svg: This part redirects the output of the command (the generated SVG image).
Step 6 (Final): Graph Analysis
“Where there’s smoke, there’s fire”.
The memory profiling revealed that memory reserved around cairo_scaled_font_create was not being released. Interestingly, this wasn’t a typical memory leak but was tied to frequent caching during repeated text rendering in the 2D canvas, leading to memory exhaustion.
The issue was traced back to text rendering on the canvas, particularly when overlapping texts were involved. Simply removing the overlapping texts resolved the problem.
This information immediately pointed to the root cause of the problem, which I quickly identified as an issue already resolved in newer versions of the Cairo library. In particular, we encountered this Cairo issue (#514 – e3649469):
Fix font options leak in _cairo_gstate_ensure_scaled_font()

Font options are allocated in _cairo_gstate_ensure_scaled_font() for local
processing, but never freed. Run _cairo_font_options_fini() on these and
fix the leak.
The Solution
“Nunca choveu que non escampara” (Galician proverb).
In the end, I was fortunate to encounter an issue that had already been addressed in the upstream version of the software. This significantly simplified the troubleshooting process, as a known solution was readily available. The memory leak was traced back to a bug in Cairo version 1.16, which had been identified and resolved in the more recent Cairo version 1.18.
As a result, the fix was straightforward: updating the Cairo library to version 1.18. After applying this update, the memory leak was fully resolved, highlighting the importance of keeping dependencies up to date and leveraging upstream fixes.
Here are some key lessons learned to avoid similar problems in the future:
- Regularly updating third-party libraries and staying informed about known issues is essential for maintaining software stability.
- Utilizing tools like Google-Perftools for memory profiling can help detect leaks early and provide a quick understanding of memory-related issues.


Leave a comment